


Solar Analyzer

คำอธิบายของSolar Analyzer
Easy to use tool to calculate details essential to help a user analyze the solar energy available to them. It provides details of a graph of the daily energy profile over the course of a year as well as the total energy produced over that period, the optimum tilt angle and details to help users size a micro-grid. This app provides a unique feature in allowing a user to quantify the number of days annually on which they won't have enough energy to meet their load which is very useful for helping to size a micro-grid.
I am a student who has just graduated with a masters in sustainable energy engineering and a bachelors in physics both from the university of Nottingham. For my masters project I decided to try to create an easy to use programme that could help a user who doesn't have very much knowledge about solar energy implement a solar phototvoltaic system. The end result is this app, a relatively brief description for which is included below.
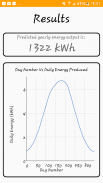
To calculate the energy output of the user's solar cells the programme performs a series of geometric calculations based on the earth's position with respect to the sun , the earth's rotation, etc... An integral is then solved over each hour of each day of the year to find the intensity of solar radiation incident on a horizontal plane from which the radiation on a plane tilted at any angle can be found. Data of the amount of cloud coverage and surface reflectivity corresponding to the user specified location is read in from NASA's 'POWER' website and used. Once the solar radiation has been calculated it is easy to find the energy produced using the area of the panels and efficiency of the cells and the inverter. This result is then presented to the user in the form of a graph of the daily energy over the course of a year and total energy produced for that year.
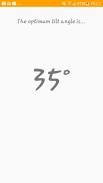
The optimum tilt angle is simply calculated by running the code described above over each tilt angle from 0 to 90 degrees and outputting the angle that corresponds to the largest annual energy generation.
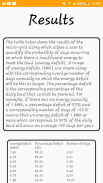
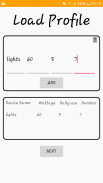
The micro-grid sizing section reads in data from the NASA website of daily insolation on a horizontal surface over a 34 year period (this is why it takes a while to run). It then restructures and performs extensive statistical analysis on the data to output a table of energy deficits and the corresponding days annually on which an energy deficit of that size or larger will occur. An energy deficit is defined as the difference between the daily load and energy produced when not enough energy is generated to meet demand. The table produced is very useful for users who are users who are trying to size a micro-grid as it allows them to see the frequency with which energy deficits occur and their extent (how much energy they will lack). Thus, size their micro-grid accordingly. This is the unique component of the app.
It is also worth noting that the NASA website from which this app extracts data is in it's beta testing phase and is sometimes unavailable in which case the app will throw an error.
Lewis O'Leary
olearylewis94@outlook.com
+44 (0)7791514094
These data were obtained from the NASA Langley Research Center POWER Project funded through the NASA Earth Science Directorate Applied Science Program.
Icons made by Vectors Market from www.flaticon.com is licensed by CC 3.0 BY
ง่ายต่อการใช้เครื่องมือในการคำนวณรายละเอียดที่จำเป็นเพื่อช่วยให้ผู้ใช้วิเคราะห์พลังงานแสงอาทิตย์ที่มีให้ มันมีรายละเอียดของกราฟรายละเอียดของการใช้พลังงานในชีวิตประจำวันในช่วงเวลาของปีเช่นเดียวกับพลังงานทั้งหมดที่ผลิตในช่วงเวลาที่มุมเอียงที่เหมาะสมและรายละเอียดเพื่อช่วยให้ผู้ใช้ขนาดไมโครกริด app นี้มีคุณสมบัติที่ไม่ซ้ำกันในการช่วยให้ผู้ใช้ในการวัดปริมาณจำนวนวันเป็นประจำทุกปีที่พวกเขาจะไม่ได้มีพลังงานพอที่จะตอบสนองความต้องการในการโหลดของพวกเขาซึ่งเป็นประโยชน์อย่างมากในการช่วยให้มีขนาดไมโครกริด
ฉันเป็นนักเรียนที่ได้จบการศึกษาเพียงกับปริญญาโทในสาขาวิศวกรรมพลังงานที่ยั่งยืนและปริญญาตรีในสาขาฟิสิกส์ทั้งจากมหาวิทยาลัยนอตติงแฮมที่ สำหรับโครงการต้นแบบของฉันฉันตัดสินใจที่จะพยายามที่จะสร้างเรื่องง่ายที่จะใช้โปรแกรมที่จะช่วยให้ผู้ใช้ที่ไม่ได้มีความรู้มากเกี่ยวกับพลังงานแสงอาทิตย์ใช้ระบบพลังงานแสงอาทิตย์ phototvoltaic ผลลัพธ์ที่ได้คือการตรวจสอบนี้เป็นคำอธิบายที่ค่อนข้างสั้นซึ่งรวมอยู่ด้านล่าง
การคำนวณปริมาณการผลิตไฟฟ้าของเซลล์แสงอาทิตย์ของผู้ใช้โปรแกรมจะดำเนินการชุดของการคำนวณทางเรขาคณิตขึ้นอยู่กับตำแหน่งของโลกที่เกี่ยวกับดวงอาทิตย์, การหมุนของโลก ฯลฯ ... คำหนึ่งจะแก้ไขได้แล้วกว่าทุกชั่วโมงของแต่ละวันของ ปีเพื่อค้นหาความเข้มของรังสีแสงอาทิตย์บนระนาบแนวนอนจากการที่รังสีบนเครื่องบินเอียงที่มุมใด ๆ ที่สามารถพบได้ ข้อมูลของจำนวนเงินความคุ้มครองเมฆและสะท้อนพื้นผิวที่สอดคล้องกับสถานที่ตั้งของผู้ใช้ที่ระบุถูกอ่านจากนาซ่า 'พลัง' เว็บไซต์และใช้ เมื่อรังสีดวงอาทิตย์ได้รับการคำนวณมันเป็นเรื่องง่ายที่จะหาพลังงานที่ผลิตโดยใช้พื้นที่ของแผงและประสิทธิภาพของเซลล์และอินเวอร์เตอร์ ผลที่ได้นี้จะนำเสนอแล้วให้กับผู้ใช้ในรูปแบบของกราฟของการใช้พลังงานในชีวิตประจำวันในช่วงปีและพลังงานทั้งหมดที่ผลิตสำหรับปีที่ผ่านมา
มุมเอียงที่เหมาะสมจะถูกคำนวณโดยเพียงแค่ใช้รหัสที่อธิบายข้างต้นมากกว่ามุมเอียงแต่ละ 0-90 องศาและมุมการแสดงผลที่สอดคล้องกับการผลิตพลังงานประจำปีที่ใหญ่ที่สุด
ส่วนไมโครกริดปรับขนาดอ่านข้อมูลจากเว็บไซต์นาซาไข้แดดชีวิตประจำวันบนพื้นผิวแนวนอนเป็นระยะเวลากว่า 34 ปี (นี่คือเหตุผลที่มันใช้เวลาในขณะที่จะเรียกใช้) จากนั้นจะปรับโครงสร้างและดำเนินการวิเคราะห์ข้อมูลทางสถิติอย่างกว้างขวางเกี่ยวกับข้อมูลการส่งออกตารางของการขาดดุลพลังงานและวันที่สอดคล้องกันเป็นประจำทุกปีในวันที่มีการขาดดุลพลังงานขนาดนั้นหรือขนาดใหญ่จะเกิดขึ้น ขาดพลังงานถูกกำหนดให้เป็นความแตกต่างระหว่างการโหลดทุกวันและพลังงานที่ผลิตเมื่อไม่ได้ใช้พลังงานมากพอที่จะถูกสร้างขึ้นเพื่อตอบสนองความต้องการ ตารางที่ผลิตเป็นประโยชน์อย่างมากสำหรับผู้ใช้ที่เป็นผู้ใช้ที่มีความพยายามให้มีขนาดไมโครกริดที่จะช่วยให้พวกเขาเพื่อดูความถี่ที่ขาดดุลพลังงานเกิดขึ้นและขอบเขตของพวกเขา (เท่าใดพลังงานที่พวกเขาจะขาด) ดังนั้นขนาดของไมโครกริดตาม นี้เป็นองค์ประกอบที่ไม่ซ้ำกันของแอป
นอกจากนี้ยังเป็นที่น่าสังเกตว่าเว็บไซต์ของนาซาที่ app นี้สารสกัดจากข้อมูลที่อยู่ในนั้นเป็นขั้นตอนการทดสอบเบต้าและบางครั้งก็ไม่สามารถใช้งานในกรณีที่ app ที่จะโยนความผิดพลาด
ลูอิสแลร์รี่ส์
olearylewis94@outlook.com
+44 (0) 7791514094
ข้อมูลเหล่านี้ได้ที่ได้รับจากโครงการโรงไฟฟ้าพลังงานนาซาแลงก์ลีย์ศูนย์วิจัยผ่านกองทุนนาซา Earth Science คณะกรรมการโครงการวิทยาศาสตร์ประยุกต์
ไอคอนทำโดย เวกเตอร์ตลาด จาก www.flaticon.com ได้รับอนุญาตจาก CC 3.0 จำแนกตาม
Solar Analyzer--เวอร์ชั่น8.8
(15-10-2019)
Solar Analyzer - ข้อมูล APK
เวอร์ชั่น APK: 8.8แพ็คเกจ: com.oleary.lewis.solarenergyเวอร์ชั่นล่าสุดของSolar Analyzer


 3.38
3.38

 4.34
4.34


แอปในประเภทเดียวกัน


คุณอาจจะชอบ...


